BC Wine vs Imports
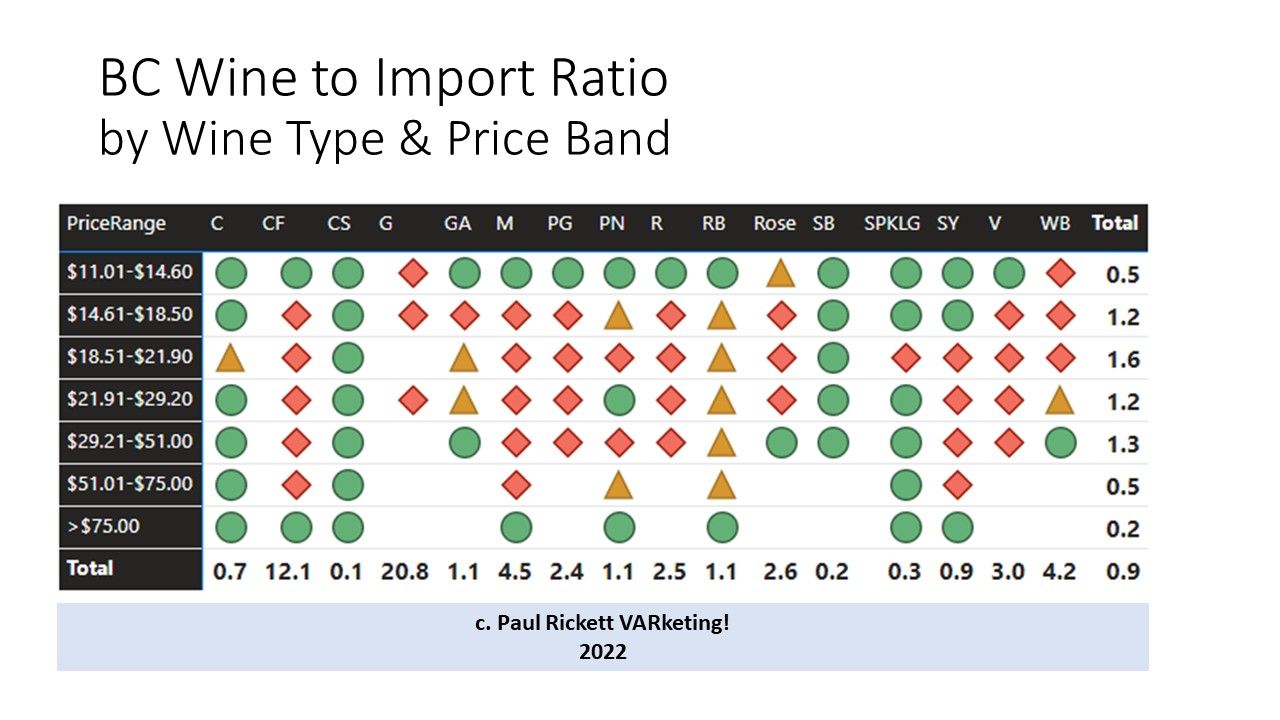
BC's production costs (land, labour, etc.) means that wineries are really challenged to profitably compete in the under-$11 wholesale segment. However, they can be a strong competitor in higher price bands depending on wine type. However, as price goes up, volume goes down - which is actually good news for most BC wineries who are small production craft-oriented farmers and fermenters. In fact, it is almost too good because BC holds commanding overall market share against imports in most price bands above $18.51 wholesale. In many cases, BC's market share versus imports in some wine types reaches above a ratio of 4:1 in 750mL sales, i.e., 80%+ market share! There are some extreme examples in the chart where BC totally dominates sales of Cabernet Franc (12.1 ratio) and Gewurztraminer (20.8 ratio).
The chart shows the market share of BC wine by wine type against imports of the same wine type in the same price range.
The green circles indicate where BC's future opportunities may lie. However, import competition is stiff in these categories and wineries are challenged to produce wines that can match imports in style, volume, cost, and - sometimes - value.
For 750mL format including all wine types, BC has an 0.8 ratio, in other words for every 8 bottles of BC wine sold in the Province 10 bottles of imported wine are sold. That's an overall 44% market share of wine above $11 wholesale. Given the limitations on the industry and its relative youth compared to global regions that is pretty respectable.