2021 Price Increases Reflect the Challenging Conditions for BC Wineries

VARketing! monitors winery websites for published prices. These are blended back into our extensive database on a quarterly basis starting with March 2022. This allows analysis of price trends by region and wine type.
Wineries have certainly been under cost and supply pressures so increases are to be expected to cover these and optimise revenue for what they have to sell owing to lower yields.
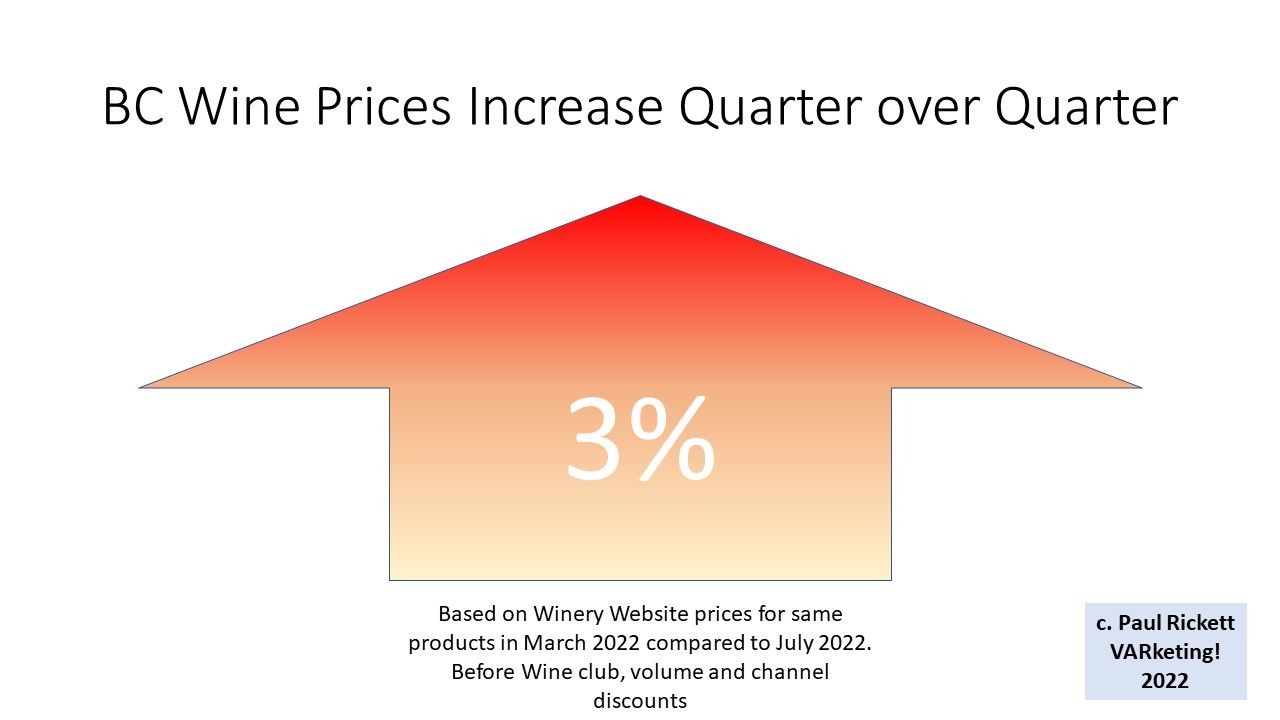
The overall 3% increase is based on products that can be matched between the two quarters. It excludes new or rebranded products released since March. As these flow into the market along with new vintages as yet unreleased, the upward trend will be sustained into the next quarter. It could even be amplified depending on the strategy a winery adopts with the introduction of excise tax from July.
While a 3% upward shift doesn't sound too daunting, it camouflages some very significant price changes in the quarter:
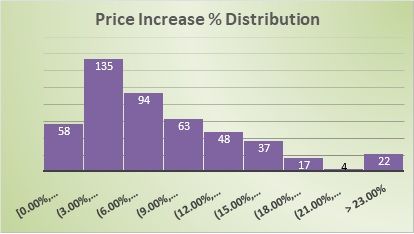
- 477 of the 1330 matches assessed had price increases. The average unweighted average increase was 9% with the median at 7%
- Over one third of these 477 products have gone up by over 10%.

Average 750mL price increase on Rose wine is 3.6%, Whites 3.4%, Red 2.7% and Sparkling only 2.0%. Within the 16 major wine types tracked, the range is 1.5%-4.4%. The top increase goes to Riesling and the low increase, to date, is Syrah. Given white and rose wines are released earlier in the year it is not unsurprising to see higher increases here than reds - so far.
Despite the somewhat aggressive increases above, there are a some factors that mitigate the impact on consumer buying patterns - at least for the moment:
- In absolute dollar terms the increases leave most prices within the regular BC wine buyer's normal discretionary price range for that particular price level. That is unless the buyer is adjusting her/his spending habits for the high inflation environment.
- Wine club pricing can be used to absorb any sticker shock for brand loyal consumers as will a carefully planned wholesale price strategy.
Between December 2021 and March 2022 wholesale unweighted average price increased over 1% for the matched products. March is the first baseline we have for retail pricing so there was some upward momentum already established prior to the baseline. The next quarter's data may show the peak of this year's pricing cycle when measured against the baseline as older vintages are finally sold through and replaced by newer.
The chart below shows the average winery selling price for the four major categories and the overall market as of July 2022, reflecting the price increases tracked to date.
Average BC wine Selling Price* per 750mL bottle July 2022

Detailed report available in August - reserve your $50 copy now
The more detailed report, available to qualified buyers, is focused on Independent wineries as the gap between average and volume weighted average is much less than the overall market at 9% (vs. 25% in the table above) because Independents generally do not produce the very high volume/lower cost wines. The report includes:
- Price Frequency and Value Distribution of BC wine
- Breakdown by major wine type (16 categories) - there are substantial variations within these categories.
- Region and sub-region comparisons
- General Recommendations and Commentary
Don't forget this data
For information on how to purchase this, please email [email protected].
How we use this data with clients
Each winery has a unique set of goals, resources, capabilities and, yes, limitations. We add the contextual and competitive environment benchmark variables so you can more confidently make pricing decisions, and integrate them into your multi-channel, go-to-market strategy. Optimising price is a critical success factor for any business.