The BC wine Brandsphere - Part 1 Brand Demographics 2016-2021

Part 1 takes a high level view of changes within the BC wine Brandsphere between 2016 and 2021. Part 2 will look at how the new brands have contributed to the overall industry volume growth from 2016-2021 and delve into more detail on trends the period.
Please read the preceding post on the taxonomy of the industry by Group/Winery/Brand Taxonomy before diving into this one. For clarification, the term 'brand', as used in our analytics, can be derived from any of the categories below.
- Distinct and separate branding produced by a winery - for example Burrowing Owl branding vs Calliope branding or Mark Anthony's Diabolica virtual brand. Even a small winery in start up mode counts as one brand, hence there will always be a minimum 1:1 brand/winery relationship. Many wineries, even larger ones, do not have multiple brands, but they may still have tiers within the brand.
- A product line when it is a material component of the total industry's production or is in itself larger than the average winery - for example Mission Hill Five Vineyards as distinct from Mission Hill Reserve AND/OR has other significant characteristics that indicate value in segregating it within the winery - for example, Bartier Bros 'Project B' joint venture. A simple tiering within a brand is not separated, for instance adding a term like "Reserve" or "Collection" to a product or series or other such qualitative identification is not in itself sufficient to reclassify as a separate Brand, especially if the label is not materially graphically differentiated. There are grey areas in this of course so remains a work in process and open to further inputs from industry and clients.
- Independent Virtual brands owned by someone other than the winery they are made by - for example, virtual brand Black Cloud was produced for the owner by different wineries over the years. It is treated as its own brand and winery regardless of manufacturer. Some of these have migrated, or are in the process of migrating, from virtual to actual wineries in the period e.g. Seven Directions.
- Private Labels have a slightly different treatment in that any identifiable private labels (most typically on behalf of Hospitality customers) are grouped together and count as one brand for a winery.
2016 is Base Data Year
- There were 346 active brands (sales >0)
- Median brand size was 1,457 cases and average was 4,748 cases but the range is enormous from >0 to 90,000 cases.
- The 173 brands above the median accounted for 96% of industry sales - I classify these as "Rootstock" brands.
- Brands below Median but above 100 cases numbered 132 - "Veraison" brands. The balance of 41 are brands with <100 cases in the year.
- These 346 brands were produced by 269 wineries. The median size of a BC winery in that year was almost identical to the brands at 1,437 cases but the average size was 6,100 cases. The volume range for wineries is very large - from 10 to 200,000+ cases.
Fast Forward to 2021
Rootstock Changes by 2021
Since Rootstocks will remain at the core of the industry for years to come it is useful to look at changes here in more detail. There will be more on Veraison and other new brand maturity classes (Third Leaf, Second Leaf, First Leaf, New Shoots and Budding) in the next post.
- Of the 173 2016 Rootstocks: 147 have remained above the 2016 median, 14 have declined below the 2016 median and 12 have effectively been discontinued. Only one of the 12 is due to a winery closure.
- From the 147 remaining above 2016 median, 65% have increased sales. 24% by > 50%.
- In 2021, Rootstock brands now account for 87% of total industry volume, down from 96%.
Overall Industry Changes
- Active brands have increased by 22% to 423, produced by 316 wineries (17% increase over 2016)
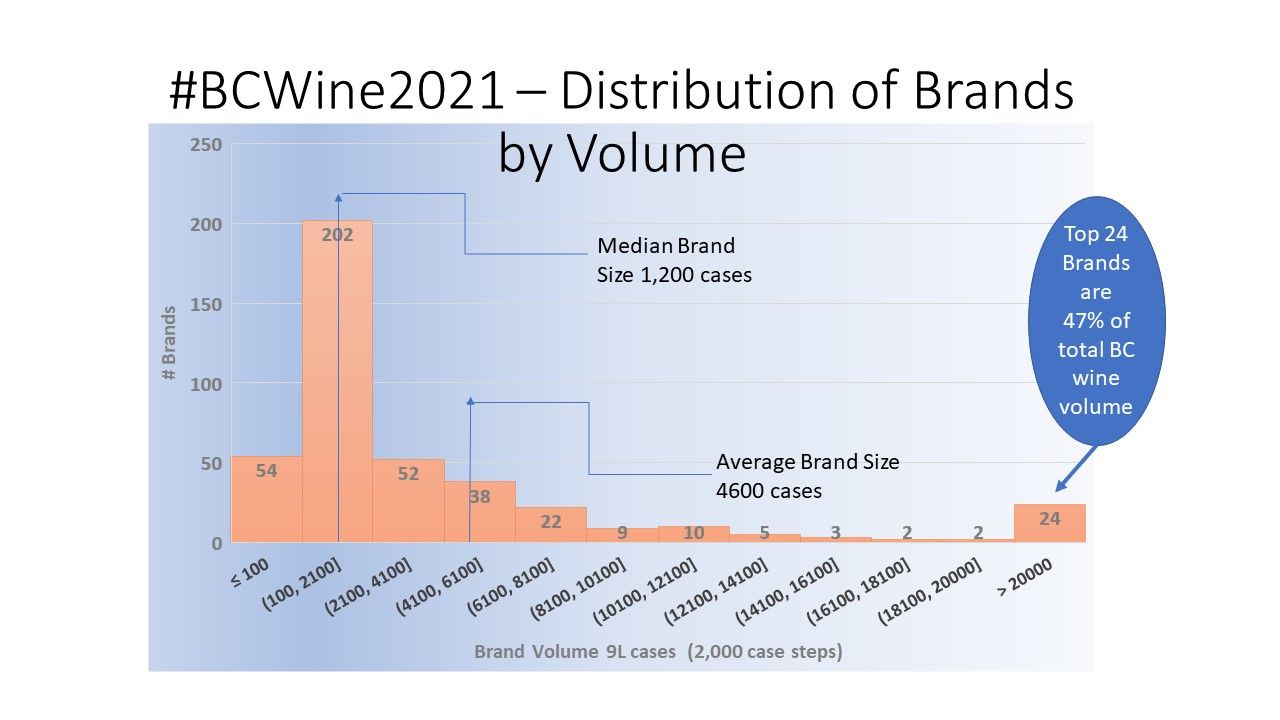
- Median brand size has decreased to 1,203 cases, as a result of the entry of new brands during the period.
- There are now 198 brands above the 2016 Median, a net increase of 25.
- The gross increase of brands to over the 2016 median is 51 is driven by growth of 25 of 2016's Veraison brands plus the addition of 26 brands that were not even active in 2016.
- The table below shows the change in the number of active brands tracked in 2016 and 2021.
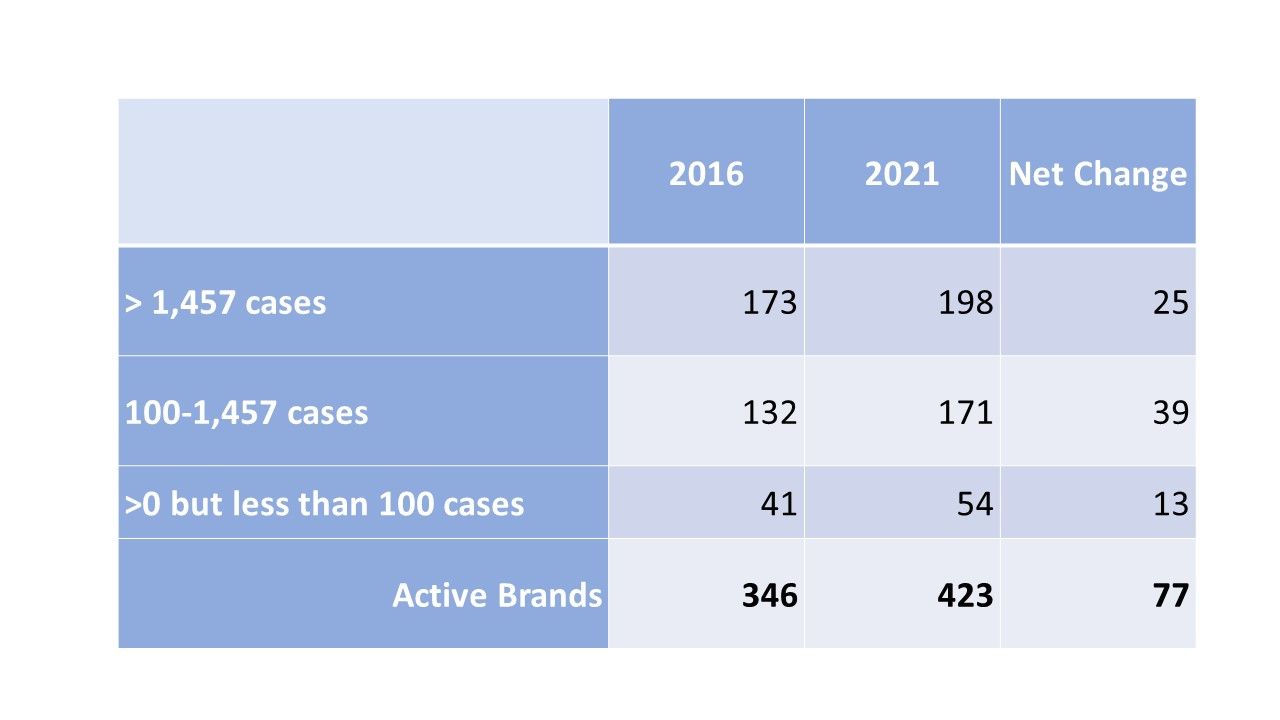
- The 77 net increase in active brands is composed of 121 brands entering the market since 2016 - often as new and often strong competition for Rootstock and Veraison brands - less 44 exiting the market - the latter mainly due to changes in brand direction at winery or group level and winery closings. Additional brands have come and gone within the period.
- 302 of 2016's 346 brands are still active. However, 119 have experienced declines since 2016. There are some likely (but not certain) causes that include reallocation of grape supply between brands within a winery or group, COVID impacts, and winery exits. These causes, though, account for only 30% of the declines so one can only surmise the reasons for the other 70%. Grape supply is possibly the #1 cause followed by COVID impacts but there are a gamut of other possibilities.
- The chart below shows the size distribution (based on sales in BC) of the 423 active brands in 2021.
Don't forget to hit the "Subscribe" button at the top right corner of the main page. Posts will be delivered directly to your inbox - and it is FREE too.