BC Cabernet Sauvignon - A Snapshot View
Last week's #BCwinechat on Twitter was about single variety Cabernet Sauvignon wines from BC. I posted a quickly created version of the charts above in the stream but thought it would be interesting to refine the original into a blog post. The notes below reference the # after title of each graphic.
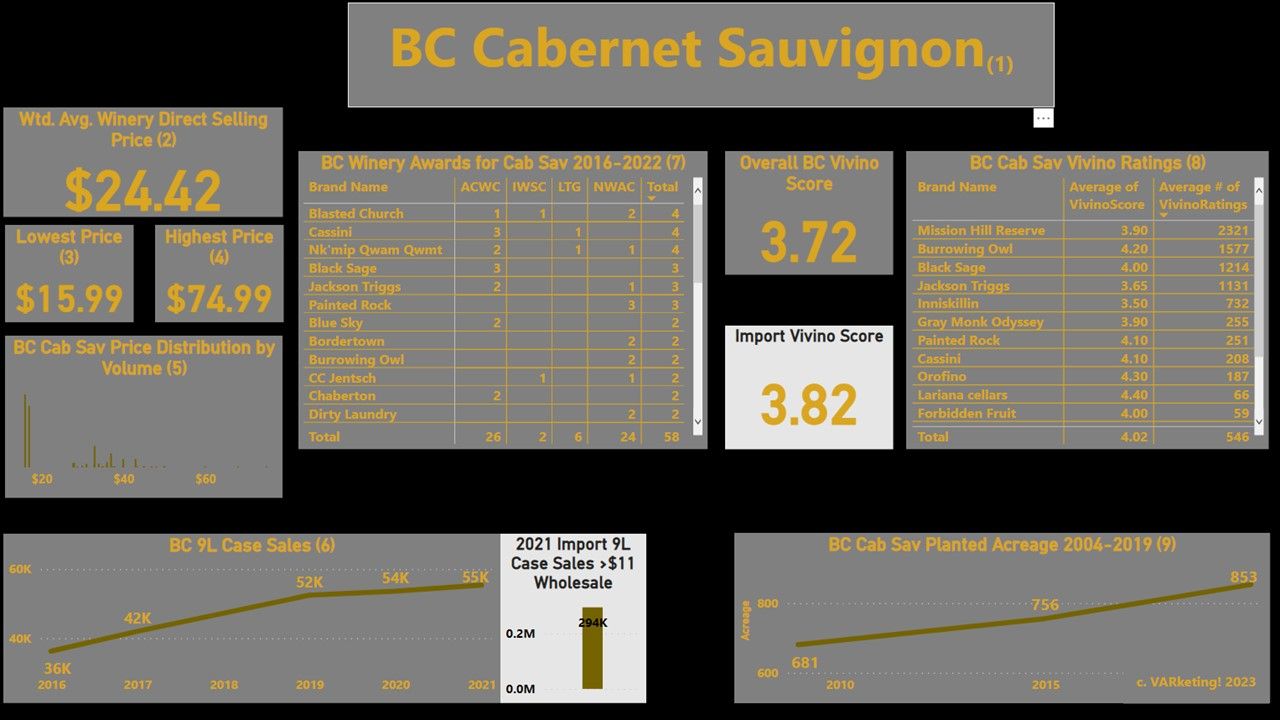
1. The data in the graphics (except where noted) is for BC 750mL format only and for wines sold as Cabernet Sauvignon in volumes greater than 25 cases.
2. Volume-weighted average selling price. Based on a sample of winery direct pricing before discounts etc. This is heavily skewed by the high volume lower-priced wines showing in #5. Excluding these, the average price is much closer to $40.
3 & 4. Price spread between minimum and maximum winery direct prices.
5. The volume disparity creating the price skew clearly shows on the chart.
6. Trend in 9L case sales. Note that in 2021 the 55K cases compares to total imports in BC of 294K cases. The import data is based on wholesale price of $11 or greater so around retail $15 and up.
7. Chart shows the number of awards won by wineries between 2016 and 2022. In the interactive version this is scrollable. The vintage 2018 is the most highly rated so far as later vintages won't have completed their award cycle until at least 2023. With a total of 58 awards over 5 major competitions tracked, BC Cab is the 12th ranked style of wine from BC.
8. Vivino scores for BC Cabernet sauvignon ranked by # of ratings received. Many of the higher-priced Cabernets are not yet rated or receive 4+ scores but have very few ratings so its not quite a fair apples to apples comparison to compare the overall ratings of BC to imports in the two summary boxes. Readers familiar with BC wineries will likely be familiar with those with 4+ scores.
9. Planted acreage from 2004-2019. 2019 is the latest acreage data for BC available. Approximately 2/3 of Cabernet Sauvignon grapes harvested go into blends rather than being sold as a single variety.